Adam Osman† Jamin D. Speer‡
February 2023
†University of Illinois Urbana-Champaign. Email:
[email protected]
‡University of Memphis. Email: [email protected]
Abstract
Aversion to “stigma” – disutility associated with a program or activity due to beliefs about how it is perceived – may affect labor market choices and utilization of social programs, but empirical evidence of its importance is scarce. Using two randomized field experiments, we show that stigma can affect consequential labor market decisions. Treatments designed to alleviate stigma concerns about taking entry-level jobs – such as how those jobs are perceived by society – had small average effects on take-up of job assistance programs. However, using compositional analysis and machine learning methods, we document large heterogeneity in the responses to our treatments. Stigma significantly affects the composition of who takes up a program: the treatments were successful in overcoming stigma for older, wealthier, and working respondents. For other people, we show that our treatments merely increased the salience of the stigma without dispelling it. We conclude that social image concerns affect labor market decisions and that messaging surrounding programs can have important effects on program take-up and composition.
The authors thank Sarah Wahby, Abdelrahman Nagy, Mohamed Yousef, Mohsen Nagy, Mohamed Omar, Norhan Muhab, Eslam Serrag, Mahmoud Shehata, and Noha Fadl from J-PAL; Eduardo Medina for research assistance; Ismail Habrouk, Nora Abou El Seoud, Farah Osman, Theo Wilson, Julie DeSoto and Hana El Fekky from EFE; Iris Boutros, Arjan De Haan, Rania Fazah and Flaubert Mbiekop from IDRC; Mohamed El Komi and Ebaa El Sayed from AUC; Mahmoud El Bably from DevGate; Hesham El Badawy from JobMaster; Eman Mohammed, Rasha Badran, Muhammad Ezzat from NEP; and the participants in the study. We thank Kareem Haggag, Ben Harrell, Joaquin Lopez, Tobias König, seminar participants at Linnaeus University, and the Editor and anonymous referees for valuable comments. UIUC IRB Approval #16766, Memphis IRB Approval #4166, AEA Trial Registry AEARCTR-0006131. We are thankful for financial support from the International Development Research Centre. Authors retained full intellectual freedom to design, analyze and interpret results. All errors are our own.
Workers’ labor market decisions depend on a host of factors, including expected wages and non-wage amenities. But their choices may also depend on beliefs about how jobs are perceived by their peers and society. Some workers may prefer unemployment to certain jobs because of such concerns, leading them to turn down assistance in securing these jobs, even when fully subsidized (Groh et al., 2015). Research has posited that aversion to these stigmas – disutilities associated with participating in certain activities or programs due to how those activities are perceived – could explain why take-up of social programs are often low despite large expected benefits (Bhargava and Manoli, 2015; Currie, 2006; Moffitt, 1983). But empirical evidence of the importance of stigma is scarce.
Many job assistance programs, such as vocational training, suffer from low take-up. There is uncertainty about the average treatment effect of programs – with some finding positive effects (Attanasio et al., 2017, 2011; Bandiera et al., 2017) and others no effect (Groh et al., 2016; Hirshleifer et al., 2016). But another reason for the low take-up could be negative stigmas that surround either the programs themselves or the entry-level jobs the programs lead to. There is also evidence of heterogeneity in who benefits from these programs (Acevedo et al., 2020; Card et al., 2018; Kluve et al., 2019; McKenzie, 2017). Given this heterogeneity, it is essential to understand how people select into these programs and how recruitment practices affect the size and makeup of the applicant pool (World Bank Group, 2018), which could then affect the overall impacts of these programs.
This paper uses two randomized experiments in Cairo, Egypt, to study the effects of information provision – specifically, information about stigma – on the take-up of labor market assistance programs.1 The first experiment recruits unemployed youth to a job training program via street-level marketing. The second recruits individuals to attend a job fair using door-to-door outreach. These programs focused on trying to help unemployed and underemployed youth get a job in the formal sector, usually in entry-level positions.
In our two experiments, we randomly vary the “pitch” delivered to individual jobseekers about these free, or highly subsidized, job assistance programs. The control groups receive basic information about the programs and their potential outcomes. The treatment groups also get this information, plus additional information designed to help individuals overcome worries about certain perceived stigmas associated with taking entry-level jobs in low-skill professions. For example, one treatment uses testimonials from alumni of the training program to alleviate the potential concern that entry-level jobs are perceived negatively by a person’s family and community.2
Our treatments did not significantly change average take-up rates. However, this does not mean our treatments were ineffective. Our key finding is that a lack of average impacts of stigma can mask large and important heterogeneity in responses. Our partners had expressed that they believed stigma concerns may act differently on different groups of people, and earlier qualitative research supports this view (Mohamed and Hamdy, 2008). For these reasons, we included questions in our recruitment surveys that would help us identify heterogeneity in effects. In our first experiment, we find large negative effects on some groups and positive effects on other groups. We then confirm these results in a second experiment, where the heterogeneity persists, and the characteristics of those most affected are similar to the first experiment. We also use the second experiment to further investigate why our treatments led to negative responses from some groups and positive responses from others. We implement an additional survey experiment that collects beliefs and expectations before and after the provision of information on stigma. This undertaking confirms that our treatments act on beliefs about stigma and do not change beliefs about monetary returns.
We assess the heterogeneity in the effects of our treatments in two ways. One is through compositional analysis, in which we explore whether the treatments change the composition of who participates in a program. Even if a particular treatment intervention has no average effect on take-up relative to control, it can alter who participates if the effects are heterogeneous. To provide a simple example, if stigma is relevant for men but not for women, then a treatment aimed at overcoming stigma will produce applicants of a different gender mix than the control message would. If we see such a difference in composition, this is evidence that our interventions have heterogeneous impacts by individual characteristics.
This is indeed what we find. In both experiments, the stigma treatments deliver applicants that are richer, older, and more likely to be currently working, relative to applicants from the control group. In many cases the differences are large and significant. For these groups, our treatments succeeded in dispelling some stigma concerns they had. Depending on the program’s goals, this may or may not be the intended target group and could affect the average impact of the program.
However, not all heterogeneous impacts may present themselves so clearly. Interventions may affect different groups in different ways that are hard to predict ex-ante, and the potential differences could be multi-dimensional. Thus, we assess heterogeneity in a second way, utilizing machine learning techniques based on Chernozhukov et al. (2022). These methods use machine learning algorithms that predict the individual treatment effect for study participants using baseline data on others in the sample. This ensures that the estimated individual treatment effects are not merely a form of data-mining, but are in fact “honest”, and are picking up heterogeneity that is generalizable. This is because the estimates are based on a training sample and does not include the effect coming from the individual themselves.
Using these methods, we again find strong evidence of heterogeneous effects of stigma in both experiments. For the same recruitment pitch, the treatment effects for some groups of individuals are significantly different from the treatment effects for others. Some people are responding strongly negatively to our message, while others are responding positively or not at all. We also generate a multi-dimensional Lasso-based index of baseline characteristics that predicts the individual treatment effect. We find that those who apply for the program in the treatment group are more likely to score higher on this index, relative to those who apply for the program in control, again showing compositional differences in those who apply. Many studies have failed to find much evidence of stigma depressing take-up on average (see Currie (2006) for a survey), but as we show, this may be due to underlying heterogeneity that went undetected.
Our second experiment serves to both confirm the heterogeneity found in our first experiment and better explore mechanisms. In particular, we hypothesize that the overall effects of our treatments in the first experiment were combining a negative “salience” effect and a positive “mitigation” effect. Hence, in Experiment 2, we include two treatments to separate these forces. The first treatment mentions the stigmas surrounding entry-level jobs but does not try to dispel them. This treatment reduces take-up for practically all individuals. On the other hand, when we add in the testimonials to try to mitigate the stigmas, we find the negative effects significantly attenuate. This confirms that our mitigation attempts in Experiment 1 did help dispel some stigma concerns but were often outweighed by the negative salience effects. This shows the need for care in attempts to dispel stigma, since overall impacts will depend on the combination of the salience effect and the mitigation effect.3
In a follow-up survey experiment described in Section 5, we confirm two key findings that help us interpret our main results. First, we show that there is belief among a sizeable minority of young Egyptian jobseekers that there are negative stigmas surrounding entry-level jobs. For example, 43% of jobseekers acknowledge that many people in society look down on these jobs. Second, we show that our treatments affect people’s beliefs about these stigmas but do not affect their beliefs about the monetary returns to these jobs. This gives us confidence that beliefs about stigma are driving our main results and are important for understanding the Egyptian labor market.
Our study has two main research goals. First, we want to investigate and document the importance of negative stigmas surrounding entry-level jobs in the context of labor market assistance programs. Second, we want to investigate the impacts of attempts to overcome these negative stigmas. Most of the prior literature has focused on perceptions related to participating in a social program itself, whereas our main treatments are focused on perceptions related to the program outcomes (entry-level jobs in this case). However, there could also be a negative stigma associated with taking part in any kind of assistance program, particularly one intended for the poor. This “welfare stigma” is the focus of most of the stigma literature in economics (e.g., Moffitt, 1983). To look at this, we also include a treatment in experiment 1 that focuses on the program’s reduced cost for those in need. We find little evidence for the importance of welfare stigma in this context. Telling recruits that the program is subsidized “to help those in financial hardship” has no significant effect on application rates or program composition, and we do not find significant evidence of heterogeneity in these effects. Our results suggest that in some contexts the stigmas surrounding program outcomes (e.g., entry-level jobs) may be more important than stigma surrounding program participation itself.
We make several important contributions to the literature. First, we show that social image concerns surrounding entry-level jobs can affect labor market decisions and investments. This is important because these jobs are typically the stepping stone to future employment (Groes et al., 2015; Sicherman and Galor, 1990). The literature on social image (surveyed in Bursztyn and Jensen (2017)) studies how people’s self-perception and society’s perception of them can influence their behavior, both for good and ill. People will pay to project a certain image to others (Bursztyn et al., 2016; Cruces et al., 2013), and willingness to do so is heterogeneous (Friedrichsen and Engelmann, 2018). Concerns about social image can impact educational investments (Bursztyn and Jensen, 2015), attitudes about gender and work (Bursztyn et al., 2020), and personal financial decisions (Ghosal et al., 2020). Our study draws a direct connection between social image concerns and decisions about jobs and unemployment. Some workers’ labor market decisions can appear confusing if these concerns are not well understood.
We also show that there is substantial heterogeneity in how stigma, and attempts to overcome stigma, affect people’s labor market decisions. Maturity, work experience, and family income seem to mitigate the negative effects of stigma in our experiments. It is important for governments, program administrators, and researchers to be aware of potential heterogeneous effects of various recruitment methods. Different recruiting tools can alter the composition of the participant pool even if they have no effect on overall take-up, which could alter the effectiveness of programs in important ways (Card et al., 2018). Depending on the program’s goals, this may also affect how well-targeted the assistance is. A large literature in development economics considers the difficulties of targeting social programs to the beneficiaries intended by policy-makers (reviewed in Hanna and Karlan (2017)), and messages about stigma could play a role in improving targeting outcomes.
Finally, we show that welfare stigma is not important in this context. While welfare stigma is often assumed to exist (Besley and Coate, 1995; Moffitt, 1983; Stuber and Schlesinger, 2006), it is difficult to distinguish from transaction costs (Currie, 2006), and there is little empirical evidence of its importance (Currie, 2003; Remler and Glied, 2003; Schofield et al., 2019; Stuber and Schlesinger, 2006). A recent lab experiment by Friedrichsen et al. (2018) finds that stigma reduces take-up of a welfare-like benefit. On the other hand, the interventions by Bhargava and Manoli (2015) aimed at overcoming welfare stigma were ineffective. Our setting is one in which the potential for real-world stigma is more salient, but our results show that welfare stigma has minimal effects on program take-up and composition. As far as we are aware, ours is the first experimental evidence on welfare stigma in a developing country setting.
The paper proceeds as follows. Section 2 discusses the local context of the experiments. Sections 3 and 4 detail the design and results for the experiments on labor market stigmas, and Section 5 describes our follow-up survey experiment. Section 6 discusses our results on welfare stigma, and Section 7 concludes.
Our study takes place in the greater Cairo area of Egypt, a middle-income country with a PPP-adjusted GDP per-capita of about $12,000. In 2016, Egypt faced a 33.4% unemployment rate among workers age 15–24, among the highest of any country (ILO, 2016). The official minimum wage at the time of the study was 1,200 EGP/Month, but there is a sizeable informal sector that pays below that.
There are many possible supply- and demand-side explanations for Egypt’s labor market woes, which predate the political instability of the last decade. We focus on the negative stigmas surrounding available entry-level positions. Unemployed youth may prefer to remain unemployed rather than work in the jobs that are available, perhaps because the jobs are stigmatized – they are looked down upon in society or professionally unappealing. Anecdotally, policymakers, NGOs, and job seekers expressed to us that this is important for understanding the Egyptian labor market. Previous qualitative research has also documented this phenomenon in Egypt (Mohamed and Hamdy, 2008; Said and El-Shafei, 2021), and Groh et al. (2015) find strong evidence consistent with this type of behavior in nearby Jordan.
In our first experiment, we partnered with the Egypt office of a well-known job matching and training NGO called Education for Employment (EFE). The majority of EFE’s training is focused on preparing young, college-educated individuals for entry-level service jobs in hotels, restaurants, and retail shops. We worked with EFE to design different methods to recruit individuals for these training programs, which we outline below. While EFE was successful in filling most of their training classes, doing so was a regular challenge despite providing a highly subsidized (often free) training program. In Experiment 2, we worked with JobMaster, a human resource company that hosted a job fair for several large companies. Both organizations mentioned stigma-related concerns as a primary challenge.
The term “stigma” is used broadly in the literature and is difficult to define precisely. Moffitt (1983) defined welfare stigma as “a disutility arising from participation in a welfare program” (that is, a program intended for the needy). Other researchers have explored the ideas of “social stigma” – disutility due to what other people think of one’s participation (Major et al., 1998); “personal stigma” – disutility due to how one feels about oneself (Manchester and Mumford, 2010); “ability stigma” – being seen as less able; and “free-rider stigma” – being seen as willing to live off others (Friedrichsen et al., 2018). Stigma thus has a variety of sources and applications. In all cases, the disutility one gets from some action comes from one’s beliefs about how that action will be perceived, either by oneself or by others. Treatments to alleviate stigma, then, must work by changing these beliefs.
Based on our discussions with our partners, we decided to explore four main types of stigma. The first three concern negative feelings about entry-level jobs, while the fourth concerns negative feelings about assistance programs themselves. The first is “social stigma”, a sense that entry-level jobs are looked down upon by society, family, and potential marriage partners. This idea came up frequently in our discussions with our Egyptian partners. Here the disutility from taking an entry-level job comes from one’s beliefs about how the job will be perceived by peers and society. Our treatment will attempt to alleviate these concerns.
The second stigma is “professional stigma”, the belief that entry-level jobs are looked down on by future employers, hindering future career progress. Here the disutility comes from one’s beliefs about how the job will be perceived by hypothetical future employers. The third is “personal stigma”, the internal sense of disappointment associated with performing a job that is not rewarding (e.g., Major et al., 1998). Here the disutility comes from beliefs about how one will feel about oneself if one takes this job. As with social stigma, our treatments will attempt to alleviate the concerns over professional and personal stigma by altering beliefs.
As we describe below, we try to isolate the effects of stigma by giving everyone (both treatment and control groups) the same information about financial returns to the programs. We are attempting to change their beliefs about how the jobs are perceived, but not their beliefs about the returns to the program. Conceptually, though, it is impossible to completely separate stigma from the returns to an activity. Engaging in a stigmatized activity could reduce one’s social, professional, and personal returns to that activity. Our separate treatments attempt to bring additional focus on each of these dimensions individually, but they are all interlinked. For example, professional returns are related to income, and income is known to affect both social standing and personal happiness. We inform both treated and control individuals in the exact same way about financial returns to the programs, in an attempt to ensure that our treatments are working on other dimensions. However, it is not possible to truly isolate the effects of stigma while holding all returns constant, because stigma itself affects those returns. Nonetheless, as we will show, concerns about stigma are real and affect labor market decisions, and hence worthwhile to study in a real world setting.
The fourth stigma, which refers to participation in an assistance program rather than the action of taking a job, is “welfare stigma”, the disutility that comes from participating in a program meant for the poor (Moffitt, 1983). Here the stigma comes from one’s beliefs about how participation in the program will be seen both by oneself and by others.
Our first experiment, implemented from August 2016 to February 2017, used in-person, street-level marketing in different areas of Cairo to recruit for the EFE job training program described in the previous section. Young adults were approached on the street by a surveyor and asked if they wanted to hear about a training program being offered for youth interested in finding jobs. If they answered yes, basic eligibility information was collected. If the person was eligible for the training program (as defined by the NGO), more information was collected and they received a randomized recruitment pitch from the surveyor.4
We then gave pitches aimed at three types of stigma: professional, personal, and social. The control group was given information about the program’s purpose, location, duration, and the average incomes of individuals who graduated from the program 1 year and 5 years ago. For the treatment arms, we adjusted the control pitch to include additional information about social stigma, professional stigma, or personal stigma. In these three cases, we collected testimonials from previous graduates of the training program that described how the types of stigma we thought people would be worried about were in fact not as important as the potential job-seekers may have thought.
In the “social stigma” treatment, we included quotes from past alumni of the training program about how graduating from EFE had led to greater support and respect from their families. For the “professional stigma” treatment, we included examples and quotes from alumni describing promotions and professional growth opportunities they experienced in the years following their graduation and taking of an entry-level position. In the “personal stigma” treatment, we included statistics from our alumni survey about job satisfaction as well as quotes from alumni about the enjoyment of their initial job placements. The full text of these treatments can be found in the Appendix, and Table A1 shows that the randomization was successful.
After hearing the pitch, individuals were invited to sign up for the training on the spot. Conditional on agreeing to apply, they were then asked more detailed questions related to their prior work history and family background. One limitation of this design (as well as the design of the second experiment) is that it does not allow us to collect explicit data on beliefs and expectations related to stigma. We worried that collecting these data would affect how individuals responded to the treatments (i.e., Hawthorne effects), as they might realize they were part of a research study.
Street-level recruiting is fairly intensive (relative to, say, online ads) and also allows for better screening of individuals and more data collection about their backgrounds. We were particularly interested in collecting data on income, because we thought stigma concerns might be most relevant for those of higher socioeconomic status (SES). To get a proxy for SES, we included a question before the information pitches about the type of transport people primarily take. We classify individuals who take private car or mobility on demand services (e.g., Uber) as “relatively rich”.5
Our outcome of interest is applying for the program. Application rates are high, with the control group applying for the program 43% of the time. Unfortunately, only a handful of applicants ended up participating in the training, leading to insufficient power to detect effects on enrollment. Experiment 2 will overcome this limitation.
Panel A of Table 1 reports the average treatment effects from Experiment 1. Across all three stigma treatments, we find small average impacts on take-up that are not statistically significant, with negative point estimates for social and professional stigma.6 The negative point estimates, although insignificant, were initially surprising to us, as the treatments were designed to dispel any stigmas surrounding the entry-level jobs, and thus increase take-up. But we also expected that there would be heterogeneity in the treatment effects, in line with initial discussions with our partners who had expressed that they believed stigma concerns may act differently on different groups.
The average results mask considerable heterogeneity. We assess heterogeneity in two different ways. First, we utilize methods from Chernozhukov et al. (2022), which provides a strategy for detecting heterogeneity in an “agnostic” fashion. This strategy utilizes machine learning algorithms and sample-splitting cross-validation techniques, using baseline covariates to estimate two models that predict the outcome of interest (in our case applying for the program) depending on whether an individual is in the treatment group or control group. It splits the sample so that it can generate a model in the “training set” and produces valid predictions in the “testing set”. It then takes the difference between these models to be the “individual treatment effect” (ITE). The sample is then sorted by their ITEs and split into 5 ordered groups, which are used to estimate the “Group Average Treatment Effect”. It implements this procedure 100 times and takes the median estimate while producing valid confidence intervals. In essence, this strategy identifies which people have the largest predicted response to treatment and which have the lowest. We provide more details of this method in the Appendix.7
In Panel B of Table 1, we report the estimated treatment effects for those in the highest estimated ITE group and those with the lowest estimated ITEs. We first consider the “social stigma” treatment. Those in the highest ITE group increase their application rates slightly in response to this treatment, while those in the lowest ITE group decrease their application rates by a highly significant 15.5 percentage points. The difference between the treatment effects for these top and bottom groups is significant at the 1% level (p = 0.009). We take this as strong evidence of heterogeneous treatment effects. We repeat the analysis for professional stigma and again find a large and statistically significant difference in the effects on the top and bottom group (p = 0.015). On the other hand, we do not find any evidence of heterogeneity in the effects of the personal stigma treatment.8
Table 1: Job Training Application Rates (Experiment 1)
| (1) Social | (2) Professional | (3) Personal | |
|---|---|---|---|
| Panel A: Average Treatment Effect | |||
| Treatment Indicator | −0.019 | −0.029 | 0.006 |
| (0.026) | (0.026) | (0.025) | |
| Mean of Control Group | 0.331 | 0.331 | 0.331 |
| Number of Observations | 1460 | 1470 | 1464 |
| Panel B: Heterogeneous Treatment Effects by ML Group | |||
| Treatment Effect for Top Group | 0.054 | 0.074 | 0.073 |
| (0.058) | (0.056) | (0.056) | |
| Treatment Effect for Bottom Group | −0.155*** | −0.125** | 0.047 |
| (0.056) | (0.058) | (0.058) | |
| P-Value for difference between groups | 0.009 | 0.015 | 0.756 |
| Number of Observations | 1460 | 1470 | 1464 |
| Panel C: Compositional Difference in Applicants, Treatment vs. Control | |||
| Lasso-Based Index | 0.174** | 0.209*** | 0.148** |
| (0.083) | (0.079) | (0.075) | |
| Individual Characteristics: | |||
| Age | 0.125 | 0.235 | −0.097 |
| (0.198) | (0.205) | (0.196) | |
| Male | 0.033 | 0.046 | −0.025 |
| (0.036) | (0.037) | (0.037) | |
| Rich | 0.048 | 0.087*** | 0.051* |
| (0.031) | (0.032) | (0.030) | |
| Currently Working | 0.045 | 0.070** | 0.034 |
| (0.035) | (0.035) | (0.034) | |
| University Degree | −0.023 | 0.002 | −0.045 |
| (0.035) | (0.036) | (0.035) | |
| Number of Observations | 611 | 611 | 631 |
Notes: Column 1 reports the results for the “Social Stigma” treatment, Columns 2 & 3 report results for the “Professional Stigma” & “Personal Stigma” treatments respectively. Panel A reports how the treatment messages affected the proportion of individuals who applied for the program on average. Panel B reports the effects of the treatment on the individuals in the top & bottom “Individual Treatment Effect” groups as assigned by the methods from Chernozhukov et al. (2022). Panel B also reports the p-value for a test of equality of coefficients for the top and bottom groups. Panel C compares the average characteristics of applicants in the treatment and control groups. The top row shows how the applicants differ on an index produced by running a lasso regression of the “Individual Treatment Effects” on all pairwise combinations of our baseline data. The following rows show differences between applicants in treatment and control on a subset of baseline variables. Control means for the five characteristics are 24.5, 0.66, 0.14, 0.25 & 0.64 respectively. Robust standard errors in parentheses. Significance * .10; ** .05; *** .01.
Our second approach utilizes compositional analysis to assess heterogeneity, seen in Panel C. In particular, we analyze whether the characteristics of applicants in the treatment group differ from applicants in the control group. Even if stigma has no average effect on take-up (as we found in Panel A), heterogeneous effects could alter the composition of who applies, because the treatments may work differently on different subgroups in our sample.
We first implement a Lasso regression of the estimated individual treatment effect (ITE) on our baseline characteristics and their pairwise interactions. This produces an index of characteristics that predicts who will respond more to treatment. We then compare the value of that index for applicants in the control group and applicants in the treatment group and find that in the social stigma treatment, applicants from the treatment group score 0.174 standard deviations higher on this index than applicants from the control group, with the difference significant at the 5% level.9 This proves that there was a meaningful impact of the stigma treatment; it changed the composition of who applied to the program and who did not.
The Lasso-based index does not provide a simple interpretation, as is common in machine learning analysis (Mullainathan and Spiess, 2017). Therefore in Panel C we also test how individual characteristics of applicants differ between the treatment and control groups. We find that applicants from the treatment group are older, richer, more likely to be male, and more likely to be currently working, though none of these is significant for social stigma.
For professional stigma, we find large differences in the composition of applicants from treatment relative to control. The differences are similar in sign to those in the social stigma treatment, with treated applicants who are significantly richer and more likely to be working. While the confidence intervals are large, the point estimates suggest a sizeable impact. The coefficients imply that if everyone got the professional stigma treatment, the share of applicants who are rich would increase by 62% relative to control, and the share currently working would increase by 28%. For professional stigma, despite not finding statistically significant differences in the treatment effects of those in the highest and lowest ITE groups (Panel B), we do find that the treatment significantly altered the composition of applicants (Panel C).10 This shows that this treatment is nonetheless affecting different people differently.
These results show that stigma can play an important role in labor market decisions of job seekers. The small average impacts mask economically and statistically significant heterogeneity. Some groups had a negative reaction to our treatments, decreasing their rate of application to a fully subsidized job training program. Others reacted positively, increasing their application rates. Those that responded negatively to the treatment may have done so because the treatments reinforced existing beliefs of how jobs are perceived (increasing the salience of the stigmas) or because the treatments increased their perception of how widely held these ideas about stigmas are. For those that responded positively, we seem to have been successful in at least partially dispelling concerns they had about stigmas related to the entry-level jobs by providing them testimonials from others who were once in a similar position as they are now. In Experiment 2, we adjust our treatments to study these mechanisms in more detail.
These results show that stigmas surrounding entry-level jobs are an important factor in application behavior of job-seekers, but the effects are heterogeneous, and attempts to dispel those stigmas can succeed for some while having the opposite effect for others. Even if stigma does not depress overall take-up, it can change the composition of who applies. Depending on who the program wants to target, this may or may not be ideal, and it could alter the effectiveness of the program (Card et al., 2018). We will discuss this further after presenting the next experiment.
Experiment 2 provides several advantages over the first experiment. First, we study a context where we expected actual attendance to be higher, and so are able to use attendance as our main outcome, which provides a stronger test of whether stigma affects more costly job market activities. Second, it serves as a replication test of the heterogeneous results of the first experiment, protecting against the potential of false positives. Third, we adjust the treatments to explore mechanisms, by separating the effects of making a stigma more salient from the effect of trying to dispelling that stigma.
In this experiment, we implemented a door-to-door information campaign in December 2019 to encourage people to attend a upcoming free job fair. The job fair was focused on the same types of entry-level service sector jobs as the training program, but should have higher participation rates because a one-time event requires less commitment.
Surveyors went from apartment to apartment, asking if there was anyone in the household who was looking for a job. If yes, they would check to see if that individual was in the same age range as the training (18 to 35). They would then collect some basic demographic information and read a randomized informational message about the job fair. To decrease the potential for information spillovers, the randomization was implemented at the building level. We cluster our results for this experiment by building.
Given the results from Experiment 1, a key focus of Experiment 2 is trying to distinguish between making a negative stigma more salient and actually dispelling that stigma. In this experiment, the control group received a message that provided information about the time and location of the job fair and the firms and types of jobs that would be available there. Treatment 1 was meant to make social stigma salient: we included the statement, “Although some people might think these types of jobs might be looked down on in society, it’s important to start somewhere.” Treatment 2 was meant to bring up the stigma and dispel it, replacing “it’s important to start somewhere” with, “actually people in these types of jobs report that their families respect and encourage them more than before they had a job.” We then included testimonials as in Experiment 1, which can be found in the Appendix. Panel B of Table A1 shows that the randomization was successful. Our anticipation was that Treatment 1 would reduce take-up relative to control (or at least not increase it), while Treatment 2 would be more successful in overcoming stigma concerns after being made more salient.
In addition to looking at actual attendance and distinguishing between salience and dispelling of stigma, we also know more about the recruits than we did in the other experiment, including their education, work status, and job aspirations, which provides the machine learning algorithms more data to use for prediction.
Table 2 reports results with attendance as the outcome. Panel A shows that, again, merely alluding to stigma decreases attendance by 1.4 percentage points. Attempting to dispel it is not effective on average. While statistically insignificant, these effects are large in relative terms, as only 5.9% of the control group attended the fair. However, these are again only average effects. To dig deeper into how our treatments work, we consider heterogeneity in treatment effects.
As in Experiment 1, we implement the machine learning techniques from Chernozhukov et al. (2022) to detect whether there are heterogeneous treatment effects. In Panel B, we report the estimated effects on the individuals who were predicted to have the highest individual treatment effects (ITEs) and those predicted to have the lowest ITEs. For the salient stigma treatment, we again find evidence of heterogeneous treatment effects: the treatment has a strong negative effect on some people and no effect on others. This difference is statistically significant (p = 0.022). It makes sense that the salient stigma treatment would have strong negative impacts on some people, since this treatment made no effort to dispel the stigma. Those who might be more concerned about the stigmas surrounding entry-level jobs would certainly be turned off by this treatment.
On the other hand, the dispelling stigma treatment does not lead to as much of a negative effect on the bottom end: the treatment effect for the bottom group (−0.044) is indistinguishable from zero and significantly different from the bottom-group treatment effect in the salient stigma treatment. This also makes sense: this treatment seems to have successfully dispelled the stigma concerns of those who were most negatively affected by it. While we had hoped that the attempt to dispel would go above and beyond the negative impacts of the salience and lead to an increase in attendance by some, this was not the case.
Panel C considers whether the stigma treatments affected the composition of program participants. We again generate an index based on a Lasso regression of the estimated ITE on all baseline characteristics and their pairwise interactions. In these regressions we only include individuals who attended the job fair. We find that attendees in the salient treatment arm are more likely to score higher on this index relative to attendees in the control group. These individuals are much older (2.8 years older, compared to a control mean of 22.5 years), almost twice as likely to be currently working (i.e., underemployed as opposed to unemployed), and slightly richer. While only age is significant due to small sample sizes here, the directions of the effects are consistent with those from Experiment 1. In both experiments, the stigma treatments are leading to a group of applicants/attendees who differ in these same ways.
Table 2: Job Fair Attendance Rates (Experiment 2)
| (1) Salient | (2) Dispelling | |
|---|---|---|
| Panel A: Average Treatment Effect | ||
| Treatment Indicator | −0.014 | −0.027 |
| (0.015) | (0.017) | |
| Mean of Control Group | 0.059 | 0.059 |
| Number of Observations | 768 | 746 |
| Panel B: Heterogeneous Treatment Effects by ML Group | ||
| Treatment Effect for Top Group | 0.006 | −0.016 |
| (0.316) | (0.027) | |
| Treatment Effect for Bottom Group | −0.120*** | −0.044 |
| (0.042) | (0.043) | |
| P-Value for difference between groups | 0.022 | 0.585 |
| Number of Observations | 768 | 746 |
| Panel C: Compositional Difference in Applicants, Treatment vs. Control | ||
| Lasso-Based Index | 0.914** | −0.089 |
| (0.411) | (0.617) | |
| Individual Characteristics: | ||
| Age | 2.792** | 1.375 |
| (1.254) | (1.711) | |
| Male | 0 | 0.25* |
| (0.183) | (0.142) | |
| Rich | 0.028 | 0.000 |
| (0.092) | (0.098) | |
| Currently Working | 0.181 | 0.208 |
| (0.133) | (0.191) | |
| University Degree | 0.042 | −0.042 |
| (0.129) | (0.160) | |
| Number of Observations | 42 | 36 |
Notes: Column 1 reports the results for the “Salient Stigma” treatment, Column 2 reports results for the “Dispelling Stigma” treatment. Panel A reports how the treatment messages affected the proportion of individuals who attended the job fair on average. Panel B reports the effects of the treatment on the individuals in the top & bottom “Individual Treatment Effect” groups as assigned by the methods from Chernozhukov et al. (2022). Panel B also reports the p-value for a test of equality of coefficients for the top and bottom groups. Panel C compares the average characteristics of attendees in the treatment and control groups. The top row shows how the attendees differ on an index produced by running a lasso regression of the “Individual Treatment Effects” on all pairwise combinations of our baseline data. The following rows show differences between attendees in treatment and control on a subset of baseline variables. Control means for the five characteristics are 22.5, 0.33, 0.08, 0.21 & 0.29 respectively. Robust standard errors in parentheses. Significance * .10; ** .05; *** .01.
These results both confirm the findings from Experiment 1 and help us better understand the mechanisms underlying the effects. Making stigma concerns more salient by including them in the script leads to a negative effect on application rates for basically everyone in the sample and has a very strong negative effect on the “bottom group”. When we provide data and testimonials to try to dispel the stigma concerns, the significant negative effects disappear. This result – that the most negative reactions are much more negative in the salient stigma treatment – helps confirm that our average results from Experiment 1 are driven by our treatments making the stigmas more salient for some people, and that those effects outweigh the attempts to dispel the stigma.
Overall, the evidence from both experiments allows us to conclude that stigmas surrounding entry-level jobs are indeed important for individual labor market choices and that successfully dispelling those stigmas is difficult. Finding ways to increase take-up (i.e., a treatment whose positive dispelling effects are greater than the negative salience effects) is a fruitful area for future research.
We also found similar effects of our treatments on the composition of applicants in Experiment 2 as we had in Experiment 1, which gives us confidence that these results are not spurious. The treatments generally deliver wealthier applicants; these may be people who are less concerned about how their job affects their social standing, because they have other sources of high status that allows them to withstand any serious negative consequences from engaging in this type of labor market assistance. Those already working – another group that tends to respond more positively to our treatments – may do so because they have already overcome any stigmas surrounding entry-level jobs when they first started working. Those who are older may be more mature and care less about what their peers think of them. While we are unable to nail down the exact reasons (as mentioned above, we did not collect beliefs data because we wanted the field test to be as natural as possible), we have clear evidence that people are responding differently to stigma and attempts to overcome it, and that this leads to changes in program composition.
The importance of the changes in composition induced by our treatments will depend on the objectives of the policymaker or training program. Some policymakers may want to maximize the impact of the program on labor market outcomes, while others may want to ensure that the program serves those most in need. In our experiments, the treatments designed to alleviate stigma delivered applicants to the program who were generally richer, older, and more likely to be already working.11 These are likely not those with the most financial need. However, this type of applicant might benefit most from the training due to their maturity, social networks, and potential complementarities between the skills they already have and those they learn in the program. In this case, a policy maker focused on impacts may find these interventions worthwhile, while one focused on the poor would not.
For researchers studying job training programs, our results show that how the program recruits its trainees (which is often not controlled by the researcher) is important to consider in evaluating the program. Researchers typically estimate the effect of participating in training relative to some control group – say, those who were eligible and applied, but were randomly chosen to not receive training. There is a third group to consider, however: those who were eligible but never applied due to the method of recruitment. Estimates of the treatment effects in such a case may not be valid for this third group, and various types of stigma may explain why they are not in the sample.
We interpret our main results as showing that there are negative stigmas surrounding working in entry-level jobs in Egypt and that our treatments caused changes in participants’ beliefs about these stigmas – in some cases making the stigmas more salient, and in other cases successfully dispelling them.
This interpretation relies on two main assumptions. One is that there are indeed stigmas surrounding entry-level positions in Egypt. Our partners clearly believe this, but thus far we have not provided evidence to support it. The second assumption is that our treatments changed people’s beliefs about these stigmas and did not change their beliefs about the monetary returns to these jobs or some other factor. If beliefs about monetary returns are changing, this would throw our interpretation into question.
To validate our interpretation and provide evidence in support of these two key assumptions, we conducted an additional survey experiment after completing the original experiments. We worked with the National Employment Pact, a Cairo-based NGO that has been matching jobseekers to “blue-collar” jobs (similar to those we refer to in our two main experiments) for over a decade. We generated an online survey experiment, and the NEP reached out to jobseekers they had recently interacted with to encourage them to participate. They worked to enroll 300 jobseekers and upon completion, the jobseekers received phone credit in appreciation for their participation.
In the survey, we first ask for some basic characteristics similar to those we collected in the original experiments (gender, age, education, etc.). Then, we ask a set of baseline questions about the participants’ perceptions of stigmas surrounding entry-level positions. For example, we ask, “Do you think a significant portion of society looks down on entry-level jobs like these?” We then provide them with several statements and ask them if they agree, disagree, or are neutral. These statements ask whether, if the participant took an entry-level job, their family, friends, and potential marriage partners would view them positively. Finally, we collect their expectations for the average salary of such a job both initially and after they had worked for five years.
After this, we randomly provide one of two information arms. The control group receives information about the typical pay for an entry-level job (“3,000 EGP per month, with the potential to double within five years”). The treatment group receives this information as well as the statement, “Although some people think that these entry-level jobs are looked down on in society, it’s important to start somewhere.” This information treatment mirrors the “salient stigma” treatment arm from Experiment 2. After the information provision, we re-ask the questions about beliefs regarding stigmas.
Because both the control and treatment groups get the same information about the monetary returns to the jobs (as was true in our main experiments), we expect that our treatment will have no effect (relative to control) on people’s beliefs about monetary returns. Instead, we expect that our treatment will increase people’s belief in negative stigmas surrounding entry-level jobs.
Table A2 shows summary statistics for the experiment and shows that the treatment and control groups are generally balanced. While there are more men in the control group than in the treatment group, it is common for one variable of many to show evidence of imbalance. A combined test shows that the samples are jointly balanced with a p-value of 0.211.12
The results from our survey experiment clearly establish two things: first, that stigmas surrounding entry-level jobs exist, and second, that our treatment affects people’s perceptions of stigma and not their monetary expectations of the jobs. These results support our two assumptions and related interpretation of the results from Experiments 1 and 2.
At baseline, we find that a significant number of jobseekers believe that there are social stigmas surrounding taking entry-level jobs. About 43% of participants agree that a significant portion of society looks down on entry-level jobs, with 10% saying “most of society” does so and 33% saying that “many people do”. Some individuals also report that their family, friends, and potential marriage partners would exhibit some stigma-related consequences to taking these types of jobs. While most people agree that these groups would continue to be proud of them if they took an entry-level job of this type, there are many that acknowledge that this type of support is not unconditional, and that there are cases where taking these types of jobs will negatively affect their relationships with these groups. In each case, about one-quarter of respondents do not agree that they would be viewed positively if they took one of these jobs.
The second result, seen in Table A3, is that our treatment increased some people’s belief in the social stigmas surrounding entry-level jobs, while it did not affect their beliefs about the monetary returns to these jobs. The first row of the table shows that, at the end of the experiment, the treatment group was more likely to say that society looks down on entry-level jobs (significant at the 1% level) and to disagree that their family would be proud of them if they took such a job (significant at the 10% level). The results for friends and marriage partners are not significant, although the point estimate for friends is negative and similar to that for family. On the other hand, there is no evidence that the treatment affected people’s beliefs about the expected salary of the jobs either now or in five years. In all of these regressions, we utilize a standard ANCOVA specification where we regress the outcome variable on a treatment indicator while controlling for the baseline value of the outcome.
The results of this survey experiment support our interpretation of the main results from Experiments 1 and 2. A sizeable percentage of jobseekers believe that entry-level jobs are viewed negatively by others, and our treatments affected some of these beliefs, while not affecting beliefs about the monetary returns to these jobs.13
The most familiar type of stigma to many economists is “welfare stigma”. While the stigmas we have focused on so far surround entry-level jobs, welfare stigma is the stigma associated with participating in a program intended for the poor or less fortunate (e.g., Moffitt, 1983).14 Welfare stigma is a common feature of discussions about take-up of social programs, but evidence of its importance is scarce (Currie, 2006). In the only two experimental treatments we are aware of, Bhargava and Manoli (2015) find little evidence of welfare stigma for EITC take-up in the US, while Friedrichsen et al. (2018) find evidence for it in a lab setting. We are not aware of any evidence on welfare stigma in developing countries.
In Experiment 1, the street-level recruitment for job training, we also tested for the importance of welfare stigma. After telling recruits the price they would pay for the training program, we randomly told some of them that the “true cost” of the program is usually higher but has been reduced through donations from organizations. Within those who get this information, a random subset was also told that the price had been reduced “to help those in financial hardship” (all of this information was true). This is the welfare stigma treatment. If welfare stigma is relevant here, those getting this treatment should have lower application rates than those who get only the true cost information. Note that, in contrast to the other stigma treatments, here our treatment is attempting to reinforce the beliefs surrounding stigma rather than alleviate the concerns.15
Attending a multi-week training program is likely more visible than receiving government benefits, so we might expect welfare stigma to be especially relevant here. On the other hand, job training programs are common in Egypt, so there may be little social stigma associated with taking part in one. This specific training program is not widely known, which might also reduce the stigma. Even if there is not this type of social stigma, though, there could be a personal welfare stigma associated with taking any assistance intended for the poor.
Table 3 shows the results. Overall, we find no effect on take-up rates in Panel A, and we can reject any large negative effect. In Panels B and C, we again use our two methods to assess any heterogeneity in treatment effects. In contrast to the results on the stigmas surrounding entry-level jobs, we find little evidence that welfare stigma is important for any group. Panel B uses the machine learning strategy from Chernozhukov et al. (2022) and finds no significant difference in treatment effects for the top and bottom groups, and no significant effect for any group.16 In Panel C, we find a marginally significant difference in composition of applicants by the Lasso-based index, but there are no differences on any observable characteristics. One might have expected to find a heterogeneous effect by wealth when looking at welfare stigma, but we do not find this.
Table 3: Testing for Welfare Stigma (Experiment 1)
| (1) Welfare Stigma | (2) Welfare Stigma | ||
|---|---|---|---|
| Panel A: Average Treatment Effect | Panel B: Heterogeneous Treatment Effects by ML Group | ||
| Treatment Indicator | 0.003 | Treatment Effect for Top Group | 0.043 |
| (0.022) | (0.050) | ||
| Treatment Effect for Bottom Group | −0.026 | ||
| (0.049) | |||
| Mean of Control Group | 0.426 | P-Value for difference between groups | 0.315 |
| Number of Observations | 1949 | Number of Observations | 1949 |
Panel C: Compositional Difference in Applicants, Treatment vs. Control (N=834)
| (3) Lasso-Based Index | (4) Age | (5) Male | (6) Rich | (7) Currently Working | (8) University Degree |
|---|---|---|---|---|---|
| 0.120* | 0.143 | −0.031 | −0.002 | −0.023 | 0.005 |
| (0.065) | (0.173) | (0.031) | (0.028) | (0.030) | (0.029) |
Notes: Column 1 reports how the welfare treatment messages affected the proportion of individuals who applied for job training. The treatment group was told that the job training was “subsidized for the poor”, while the control group in this table are those who were told that training was only “subsidized”. Panel B reports the effects of the treatment on the individuals in the top & bottom “Individual Treatment Effect” groups. Panel C compares the average characteristics of applicants in the treatment and control groups. Robust standard errors in parentheses. Significance * .10; ** .05; *** .01.
In two randomized field experiments in Egypt, plus an additional follow-up survey experiment, we provide novel evidence on the impacts of several types of stigma on the take-up and composition of labor market assistance programs. Negative stigmas associated with the prospects and social image of entry-level jobs are clearly an important factor in labor market decisions.
Attempts to counteract the stigmas associated with entry-level jobs had limited average impacts, but this masks strong heterogeneity. Our treatments made stigmas more salient for some people while successfully dispelling the stigmas for others. Agnostic machine learning techniques show evidence that different people respond very differently to our treatments. Some respond positively, while others have large negative effects. This means that attempts to overcome stigma have significant effects on the composition of who participates in a program, even if the overall effect on take-up is small. In both of our experiments, the stigma treatments deliver an applicant pool that is older, richer, and more likely to be currently working than we get from the control group. This could affect the returns to these programs. On the other hand, we find no evidence that welfare stigma affects take-up or composition of these programs.
For policymakers, our results showcase that messaging around programs is of first-order importance. Stigma may not only affect the level of take-up but also significantly change the composition of a program, and potentially its effectiveness. Additional research on stigma is needed. Careful testing of recruitment messages can help inform strategies for targeting the groups best suited for social programs.
Acevedo, P., G. Cruces, P. Gertler, and S. Martinez (2020): “How Vocational Education Made Females Better Off but Left Males Behind,” Labour Economics, 65, 101824.
Attanasio, O., A. Guarin, C. Medina, and C. Meghir (2017): “Vocational Training for Disadvantaged Youth in Colombia: A Long-Term Follow Up,” American Economic Journal: Applied Economics, 9, 131–143.
Attanasio, O., A. Kugler, and C. Meghir (2011): “Subsidizing Vocational Training for Disadvantaged Youth in Colombia: Evidence from a Randomized Trial,” American Economic Journal: Applied Economics, 3, 188–220.
Bandiera, O., R. Burgess, N. Das, S. Gulesci, I. Rasul, and M. Sulaiman (2017): “Labor markets and poverty in village economies,” The Quarterly Journal of Economics, 132, 811–870.
Besley, T. and S. Coate (1995): “Group lending, repayment incentives and social collateral,” Journal of Development Economics, 46, 1–18.
Bhargava, S. and D. Manoli (2015): “Psychological frictions and the incomplete take-up of social benefits: Evidence from an IRS field experiment,” American Economic Review, 105, 3489–3529.
Bursztyn, L., M. Callen, B. Ferman, S. Gulzar, A. Hasanain, and N. Yuchtman (2016): “Political identity: Experimental evidence on anti-Americanism in Pakistan,” Journal of the European Economic Association.
Bursztyn, L., A. Gonzalez, and D. Yanagizawa-Drott (2020): “Misperceived Social Norms: Female Labor Force Participation in Saudi Arabia,” American Economic Review, 110, 2997–3029.
Bursztyn, L. and R. Jensen (2015): “How Does Peer Pressure Affect Educational Investments?” Quarterly Journal of Economics, 130, 1329–1367.
——— (2017): “Social image and economic behavior in the field: Identifying, understanding, and shaping social pressure,” Annual Review of Economics, 9, 131–153.
Card, D., J. Kluve, and A. Weber (2018): “What works? A meta analysis of recent active labor market program evaluations,” Journal of the European Economic Association, 16, 894–931.
Chernozhukov, V., M. Demirer, E. Duflo, and I. Fernandez-Val (2022): “Generic machine learning inference on heterogeneous treatment effects in randomized experiments,” National Bureau of Economic Research Working Paper 24678.
Christensen, P. and A. Osman (2021): “The Demand for Mobility: Evidence from an Experiment with Uber Riders.”
Cruces, G., R. Perez-Truglia, and M. Tetaz (2013): “Biased perceptions of income distribution and preferences for redistribution: Evidence from a survey experiment,” Journal of Public Economics, 98, 100–112.
Currie, J. (2003): “U.S. Food and Nutrition Programs,” in Means-Tested Welfare Programs in the United States, ed. by R. Moffitt, University of Chicago Press for NBER.
——— (2006): “The Take-Up of Social Benefits,” in Poverty, the Distribution of Income, and Public Policy, ed. by D. C. Alan Auerbach and J. Quigley, Russell Sage.
Friedrichsen, J. and D. Engelmann (2018): “Who cares about social image?” European Economic Review, 110, 61–77.
Friedrichsen, J., T. König, and R. Schmacker (2018): “Social image concerns and welfare take-up,” Journal of Public Economics, 168, 174–192.
Ghosal, S., S. Jana, A. Mani, S. Mitra, and S. Roy (2020): “Sex Workers, Stigma, and Self-Image: Evidence from Kolkata Brothels,” Review of Economics and Statistics, 1–45.
Groes, F., P. Kircher, and I. Manovskii (2015): “The U-shapes of occupational mobility,” The Review of Economic Studies, 82, 659–692.
Groh, M., N. Krishnan, D. McKenzie, and T. Vishwanath (2016): “Do wage subsidies provide a stepping-stone to employment for recent college graduates? Evidence from a randomized experiment in Jordan,” Review of Economics and Statistics, 98, 488–502.
Groh, M., D. McKenzie, N. Shammout, and T. Vishwanath (2015): “Testing the importance of search frictions and matching through a randomized experiment in Jordan,” IZA Journal of Labor Economics, 4, 7.
Hanna, R. and D. Karlan (2017): “Designing social protection programs: using theory and experimentation to understand how to help combat poverty,” in Handbook of Economic Field Experiments, Elsevier, vol. 2, 515–553.
Hirshleifer, S., D. McKenzie, R. Almeida, and C. Ridao-Cano (2016): “The Impact of Vocational Training for the Unemployed: Experimental Evidence from Turkey,” Economic Journal, 127, 2115–2146.
ILO (2016): “Employment by Sex and Age – ILO Modelled Estimates,” ILOSTAT. Accessed 02-14-2020. https://ilostat.ilo.org/data.
Imbens, G. W. and J. M. Wooldridge (2009): “Recent developments in the econometrics of program evaluation,” Journal of Economic Literature, 47, 5–86.
Kemp, S. (2020): “Digital 2020: Egypt,” Retrieved from https://datareportal.com/reports/digital-2020-egypt on 2020-06-19.
Kluve, J., S. Puerto, D. Robalino, J. M. Romero, F. Rother, J. Stöterau, F. Weidenkaff, and M. Witte (2019): “Do youth employment programs improve labor market outcomes? A quantitative review,” World Development, 114, 237–253.
Lee, D. S. (2009): “Training, wages, and sample selection: Estimating sharp bounds on treatment effects,” The Review of Economic Studies, 76, 1071–1102.
Major, B., S. Spencer, T. Schmader, C. Wolfe, and J. Crocker (1998): “Coping with negative stereotypes about intellectual performance: The role of psychological disengagement,” Personality and Social Psychology Bulletin, 24, 34–50.
Manchester, C. F. and K. J. Mumford (2010): “Welfare stigma due to public disapproval,” University of Minnesota and Purdue University, unpublished working paper.
McKenzie, D. (2017): “How effective are active labor market policies in developing countries? A critical review of recent evidence,” The World Bank Research Observer, 32, 127–154.
Moffitt, R. (1983): “An economic model of welfare stigma,” The American Economic Review, 73, 1023–1035.
Mohamed, A. A. and H. Hamdy (2008): “The Stigma of wasta,” German University in Cairo Working Paper, 1–9.
Mullainathan, S. and J. Spiess (2017): “Machine learning: an applied econometric approach,” Journal of Economic Perspectives, 31, 87–106.
Remler, D. K. and S. A. Glied (2003): “What other programs can teach us: Increasing participation in health insurance programs,” American Journal of Public Health, 93, 67–74.
Said, R. M. and D. A. El-Shafei (2021): “Occupational stress, job satisfaction, and intent to leave: nurses working on front lines during COVID-19 pandemic in Zagazig City, Egypt,” Environmental Science and Pollution Research, 28, 8791–8801.
Schofield, T. P., N. Haslam, and P. Butterworth (2019): “The persistence of welfare stigma: Does the passing of time and subsequent employment moderate the negative perceptions associated with unemployment benefit receipt?” Journal of Applied Social Psychology, 49, 563–574.
Sicherman, N. and O. Galor (1990): “A theory of career mobility,” Journal of Political Economy, 98, 169–192.
Stuber, J. and M. Schlesinger (2006): “Sources of stigma for means-tested government programs,” Social Science & Medicine, 63, 933–945.
World Bank Group (2018): World Development Report 2019: The changing nature of work, World Bank.
Control: “I am from Education for Employment | Egypt. We are an organization that specializes in youth training and employment and focuses on improving the skills of graduates to support them in securing job opportunities through developing some of their skills such as presentation, communication, CV writing skills, computer skills, and the English language skills needed by the labor market. The training program normally takes about 3-4 weeks, and is located at [NGO Address]. It takes place six days a week from 9am–5.30pm, and is usually conducted in classes of 25 or so students, who all work together on a variety of topics to help them learn more about the skills that are needed in the labor market. The training takes on an interactive and practical approach and ensures that students learn how to utilize those skills to turn them into fruitful employment opportunities after graduation. We provide certificates of completion and help you find jobs after you finish the program. We also provide access to a large network of over 2000 graduates with similar profiles, and a variety of ongoing professional development courses after graduation. We ensure that all programs are market-driven and based on the needs of the local labor market. When implementing programs, we establish partnerships with private sector employers that have a demand for new high-quality employees. We are funded by a variety of sources and our phone number is [NGO Phone Number]. This training program aims to help individuals find employment opportunities that will help them grow professionally in the future. In the past, our graduates have gotten jobs like waiters, retailers, marketers, sales associates, call center agents, and e-commerce associates, etc. Average starting salaries for employed graduates are 1450 EGP per month, and after 3 years the average employed person is making about 3400 EGP per month.”
Professional Stigma: Control Pitch + “Note that although some people might think that these types of jobs might be a professional dead-end, graduates of the program who started in these jobs often end up climbing the professional ladder to become managers and directors. Overall there is a high rate of professional development amongst graduates of EFE who have taken these jobs. For example, one EFE alumnus started as a content associate and 5 years later he is currently a senior content supervisor managing a team of over 60 employees. We also interviewed some recent alumni who said ‘I definitely felt like there was scope to grow in my first job’, and ‘There was definitely room to grow professionally, 100%.’”
Social Stigma: Control Pitch + “Note that although some people might think that these types of jobs might be looked down on in society, graduates of EFE who have taken these jobs report that their families and communities hold them in higher regard. For example, one alumnus recently said about his experience, ‘[My father] now supports me and encourages me to excel a lot more than he did in the past.’ Another alumnus said, ‘My parents have always been very supportive of me, but they are definitely proud of me now.’”
Personal Stigma: Control Pitch + “Note that although some people might think that these types of jobs are not very enjoyable, there is actually high satisfaction among graduates of EFE who have taken these jobs. For example, one alumnus recently said, ‘I definitely enjoyed my first job because the workplace was very positive, and I got to know new people.’ And our records indicate that about 80% of EFE alumni stayed in their first job for more than 1 year.”
True Cost: Control Pitch + Stigma Pitch + “The true cost of the program is usually around 4000 LE, but many organizations have donated to EFE Egypt so that we can provide this at a much lower cost.”
Welfare Stigma: Control Pitch + Stigma Pitch + “The true cost of the program is usually around 4000 LE, but many organizations have donated to EFE Egypt so that we can provide this at a much lower cost. These funds are meant to help those in financial hardship.”
Info Pitch (Control): “Job Master is holding a job fair on December 14th at Ard El-Maared. A job fair is a group of companies offering different jobs for job seekers to apply on the spot. Many companies will be attending such as [5 well known employers] and others. They are trying to hire nearly 400 jobs including entry level positions in sales, drivers, security, electrical/mechanical maintenance technicians, warehouse workers, etc. Salaries range between 1900 and 4000 EGP/Month, and could reach up to 8000 for certain specializations and supervisory functions. Attendance is free.”
Salient Stigma: Info Pitch + “Although some people might think some of these entry level jobs are looked down on in society, it’s important to start somewhere.”
Dispelling Stigma: Info Pitch + “Although some people might think some of these entry level jobs are looked down on in society, people in these types of jobs report that their families respect and encourage them more than before they had a job. For example, one person we recently talked to who took an entry-level position said about his experience, ‘[My father] now supports me and encourages me to excel a lot more than he did in the past.’ Another person said, ‘My parents have always been very supportive of me, but they are definitely proud of me now.’”
Table A1: Balance for Experiments 1 & 2
Panel A: Balance for Street Level Experiment (Experiment 1)
| (1) Control | (2) Personal Stigma | (3) Professional Stigma | (4) Social Stigma | (5) Welfare Control (True Cost) | (6) Welfare Stigma | |
|---|---|---|---|---|---|---|
| Female | 0.64 {0.48} | −0.02 (0.02) | 0.03 (0.02) | 0.04 (0.02) | 0.66 {0.48} | 0.01 (0.02) |
| Age | 24.70 {2.43} | 0.13 (0.13) | 0.18 (0.13) | 0.20 (0.13) | 24.80 {2.50} | 0.01 (0.11) |
| University | 0.66 {0.48} | −0.03 (0.02) | −0.03 (0.02) | −0.03 (0.02) | 0.64 {0.48} | 0.00 (0.02) |
| Rich | 0.19 {0.39} | 0.01 (0.02) | 0.03 (0.02) | 0.00 (0.02) | 0.18 {0.39} | 0.02 (0.02) |
| Working | 0.34 {0.47} | 0.03 (0.02) | 0.02 (0.02) | 0.04 (0.02) | 0.36 {0.48} | 0.00 (0.02) |
| p-value | 0.630 | 0.523 | 0.426 | 0.865 | ||
| Obs | 747 | 717 | 723 | 713 | 976 | 973 |
Panel B: Balance for Job Fair Experiment (Experiment 2)
| (1) Control | (2) Salient Stigma | (3) Dispelling Stigma | |
|---|---|---|---|
| Female | 0.37 {0.48} | 0.03 (0.03) | 0.05 (0.04) |
| Age | 25.40 {5.55} | −0.48 (0.43) | −0.42 (0.46) |
| University | 0.20 {0.40} | 0.02 (0.03) | 0.00 (0.03) |
| Rich | 0.10 {0.30} | 0.00 (0.02) | 0.02 (0.03) |
| Working | 0.45 {0.50} | 0.00 (0.04) | −0.01 (0.04) |
| p-value | 0.470 | 0.530 | |
| Obs | 404 | 396 | 370 |
Notes: This table reports how baseline characteristics differ by group. Panel A reports differences for Experiment 1 (Street Level Recruitment). The welfare stigma treatments were cross-randomized on top of the other treatments; we control for all randomizations in our regressions. The tables also report p-values for the joint test of all reported baseline covariates on treatment assignment relative to control. Panel B reports differences for Experiment 2 (Job Fair Recruitment). Standard deviations for the control group in brackets. Robust standard errors in parentheses. Significance * .10; ** .05; *** .01.
Table A2: Balance for Survey Experiment
| (1) Control Group | (2) Treatment Group | (3) Difference | |
|---|---|---|---|
| Panel A: Demographics | |||
| Age | 28.6 | 29.1 | 0.43 (0.42) |
| Male | 0.73 | 0.60 | −0.13** (0.05) |
| Single | 0.56 | 0.50 | −0.06 (0.06) |
| College Educated | 0.50 | 0.56 | 0.06 (0.06) |
| Employed | 0.71 | 0.69 | −0.02 (0.05) |
| Relatively Rich | 0.12 | 0.14 | 0.02 (0.04) |
| Panel B: Beliefs | |||
| Society looks down on these jobs (1=Not Common, 3=Most of Society) | 1.51 | 1.55 | 0.05 (0.08) |
| Family would be proud (1=Strongly Disagree, 5=Strongly Agree) | 4.17 | 4.26 | 0.09 (0.12) |
| Friends would be proud (1=Strongly Disagree, 5=Strongly Agree) | 4.12 | 4.20 | 0.08 (0.12) |
| Marriage partners view positively (1=Strongly Disagree, 5=Strongly Agree) | 4.18 | 4.22 | 0.04 (0.12) |
| Expected Salary Now (EGP/Month) | 3690 | 3541 | −149 (115) |
| Expected Salary in 5 years (EGP/Month) | 6260 | 6381 | 121 (254) |
| p-value for joint balance test | 0.214 | ||
| Number of observations | 150 | 150 | 300 |
Notes: Each row reports the results of a regression of the baseline value of the variable on treatment. Expected Salaries winsorized at the 5% level. Robust standard errors in parentheses. Significance levels: *10% **5% ***1%.
Table A3: Impacts of Information Treatment in Survey Experiment
| (1) Control Group | (2) Treatment Group | (3) Difference | |
|---|---|---|---|
| Society looks down on these jobs (1=Not Common, 3=Most of Society) | 1.51 | 1.62 | 0.10*** (0.04) |
| Family would be proud (1=Strongly Disagree, 5=Strongly Agree) | 4.21 | 4.06 | −0.15* (0.09) |
| Friends would be proud (1=Strongly Disagree, 5=Strongly Agree) | 4.10 | 3.98 | −0.12 (0.09) |
| Marriage partners would view favorably (1=Strongly Disagree, 5=Strongly Agree) | 4.12 | 4.13 | 0.01 (0.10) |
| Expected Salary Now (EGP/Month) | 3710 | 3767 | 57 (52) |
| Expected Salary in 5 years (EGP/Month) | 6840 | 6749 | −92 (123) |
| Number of observations | 150 | 150 | 300 |
Notes: Each row reports the results of a regression of the outcome on treatment while controlling for the baseline value of the outcome. Including a control for gender does not substantively change any of the results. Expected Salaries winsorized at the 5% level. Robust standard errors in parentheses. Significance levels: *10% **5% ***1%.
The methods we use for assessing heterogeneity in treatment effects from randomized experiments are taken from Chernozhukov et al. (2022). The method they put forth can be summarized in the following steps:
They randomly split the data into two data sets: (i) a training data set, and (ii) a testing data set.
They use four machine learning algorithms in the training data set to generate a model that predicts the outcome of interest (in our case, application rates or attendance) using only baseline data for those in the control group.
They use the same types of algorithms in the training data set to generate a model that predicts the outcome of interest using baseline data for those in the treatment group.
They assess the accuracy of the machine learning predictions by validating the models’ predictions in the “testing” data set.
They produce a predicted “Individual Treatment Effect” (ITE) for people in the “testing” data set by subtracting the predicted outcome from the treatment model with the predicted outcome from the control model.
They sort individuals in the testing set by their predicted ITE and then split them into 5 groups. The “top” group has the highest predicted ITEs and the bottom group has the lowest predicted ITEs.
They run a regression in the training data set of the actual outcome on a dummy for treatment status minus the propensity score associated with being allocated to treatment, interacted with the five ITE groups, while controlling for the values of the two models generated in steps 2 & 3. This produces what they call “Sorted Group Average Treatment Effects” (GATES).
They run steps 1–7 again 100 times, each with a new random split of the original data set into the training and testing sets. This gives ITE and GATES estimates for half of the sample 100 times, or for each observation 50 times in expectation.
They take the median value of the coefficients from the GATES regressions and the median value of the standard error.
To assess significance of the median GATES estimates at the α level, they choose a conservative critical value associated with α/2 instead of the usual alpha. This is to take into account the uncertainty associated with the random splits in step 1. For example, for the median GATES estimates to be significant at the 10% level, they require a critical value of 1.96, which is usually the critical value for 5% significance.
We deviate from this procedure in two ways to maximize statistical power. First, in step 9, instead of taking the median value of the GATES coefficients from the 100 simulations, we take the median ITE value for each person in the sample. Due to the nature of the random splitting of the data in step 1, each person in the sample will get an ITE score in about half of the simulations. Taking the median value across all simulations allows us to utilize the entire sample in our regressions as opposed to only utilizing the half of the sample that was put in the “testing sample” split. All of the ITEs for each person are still “honest” in the sense that the estimate is based on data from other people in the sample and is never using the individuals’ own behavior. This is because an estimate is only generated in cases where that individual was in the testing sample, and not in the training sample.17 Second, because we do not have additional uncertainty associated with only using half of the sample, we use the conventional critical values of 1 − α in our analysis instead of 1 − α/2.
To minimize the number of tests we run, we only use the machine learning algorithm that is shown to have the most predictive ability in the testing set. Chernozhukov et al. (2022) use all four machine learning methods (elastic net, boosted trees, random forest, and neural network) each time and report results from the top two.
We also ran an experiment on Facebook in late 2018. Facebook is very popular in Egypt, with about 42 million users as of 2020 (Kemp, 2020), and has been used extensively for recruiting trainees by EFE. To explore the importance of stigma, we designed a simple experiment that we implemented on their ad platform. Facebook allows advertisers to run “split tests” which are randomized experiments of different ads providing the ability to compare the performance of ads to each other. Unfortunately the actual randomization on Facebook is implemented by the platform and is a black-box to researchers. We find imbalance on baseline characteristics which calls into question the implementation of the experiment (shown in Table A5 below). We implement a few robustness tests below that suggest that stigma does affect application rates to the program, in line with the results from Experiments 1 & 2 above, but relegate these results to the appendix to be conservative.
We tested three main ads on Facebook. The control ad simply informed people about the content, length, and format of the training program. We then adjusted the control ad to include additional information about “social stigma” and “professional stigma”. In both cases, we collected testimonials from previous graduates of the training program that described how the types of stigma we thought people would be worried about were in fact not as important as the potential job-seekers may have thought.
In the “social stigma” treatment, we included quotes from past alumni of the training program about how graduating from EFE had led to greater support and respect from their families. For the “professional stigma” treatment, we included examples and quotes from alumni describing promotions and professional growth opportunities they experienced in the years following their graduation and taking of an entry-level position.
Experimenting with Facebook advertising has its benefits and drawbacks. Facebook is able to provide access to large samples with low cost and minimal input from the researcher. Our experiment reached 767,768 young people who lived in the greater Cairo area. Individuals were able to click on the ads and sign up for training directly on the Facebook platform. Signing up is our main outcome of interest.
However, Facebook ads are not a powerful intervention. Most people ignore the ads, reducing the expected impact of the ads and requiring large sample sizes. Other drawbacks include that there are only two binary covariates available for those in the sample, gender and age range (18–24 and 25–34), as well as the inability to oversee the randomization itself. Unfortunately Table A5 shows the treatments are not balanced using traditional balancing checks. Nonetheless, we implement a set of robustness checks, and consider balance using “normalized differences” recommended by Imbens and Wooldridge (2009) in cases of very large sample size like ours. These checks suggest that our estimated impacts are plausibly robust to mistakes in the randomization procedure.
We start by regressing a binary outcome variable (whether the individual signed up for the training on the Facebook platform) on dummies for each treatment, one for “social stigma” and another for “professional stigma”. The control group is the excluded category.
Table A4: Facebook Sign Up Rates (×100) (Experiment 1)
| (1) Full Sample | (2) Pro & Social Only | |
|---|---|---|
| Professional Stigma | −0.032*** (0.009) | |
| Social Stigma | −0.047*** (0.009) | −0.015** (0.008) |
| Mean of Control Group | 0.121 | 0.087 |
| Number of Observations | 767,768 | 524,979 |
Notes: This table reports how each Facebook treatment ad affected the proportion of the sample who signed up for the job training program. The dependent variable is multiplied by 100 to make the coefficients easier to read since sign up rates were so low. Robust standard errors in parentheses. Significance * .10; ** .05; *** .01.
Column 1 provides several notable results. First, the sign-up rate in the control condition is quite low: only 0.12% of individuals served an ad signed up for the training. Despite this, we can still learn from the relative effectiveness of the different ads. We multiply the sign up rate by 100 in Table A4 to make it easier to read the coefficients. Second, we find that both ads that attempt to overcome stigma in fact lead to a negative impact on take-up rates. The professional stigma treatment leads to a decrease of 0.032 percentage points, a 26% decrease relative to the control group, and the social stigma treatment leads to a decrease of 0.047, or 39% relative to control. The social stigma effect is significantly larger than the professional stigma effect at the 5% level, suggesting that these two stigmas are distinct phenomena. While we hoped to dispel the negative stigmas with our treatments, we may have made them more salient instead.
One concern is that the depressed take-up is due to the increased length of the ad that individuals see and not the content of our treatments. However, the professional and social stigma ads are practically the same length and we find significant differences between them. This provides evidence that the content of the ad, not just the length, is a primary factor.
Figure A1: Robustness of Professional Stigma Effects to Alternate Balanced Samples
To address the potential for imbalance across groups18 we perform a robustness check similar in spirit to “Lee bounds”, where we create balanced groups by dropping individuals who are overrepresented in the treatment groups (Lee, 2009). For example, if the control arm is perfectly balanced by gender and age (50% female, 50% “young”), while the social stigma arm has additional women (e.g. 52% male), then we will be able to determine how many “excess” men there are to achieve balance. In this example it would be 4 percent of the total sample, so that after we remove 4 percentage points of men we get down to 48% men and 48% women. We then randomly choose this proportion of men and drop them from the sample, and implement the same procedure for each treatment on both gender and age. This produces a “manually balanced” sample. We then implement this procedure using 1,000 different random seeds and plot the regression coefficients for treatment in each sample. This produces a set of balanced samples whose results we compare with our primary regression coefficients. Appendix Figures A1 & A2 show that throughout the 1,000 iterations we consistently find a negative and statistically significant impact of the treatments on sign up rates, allowing us to be confident that the results are not being driven by a lack of covariate balance.
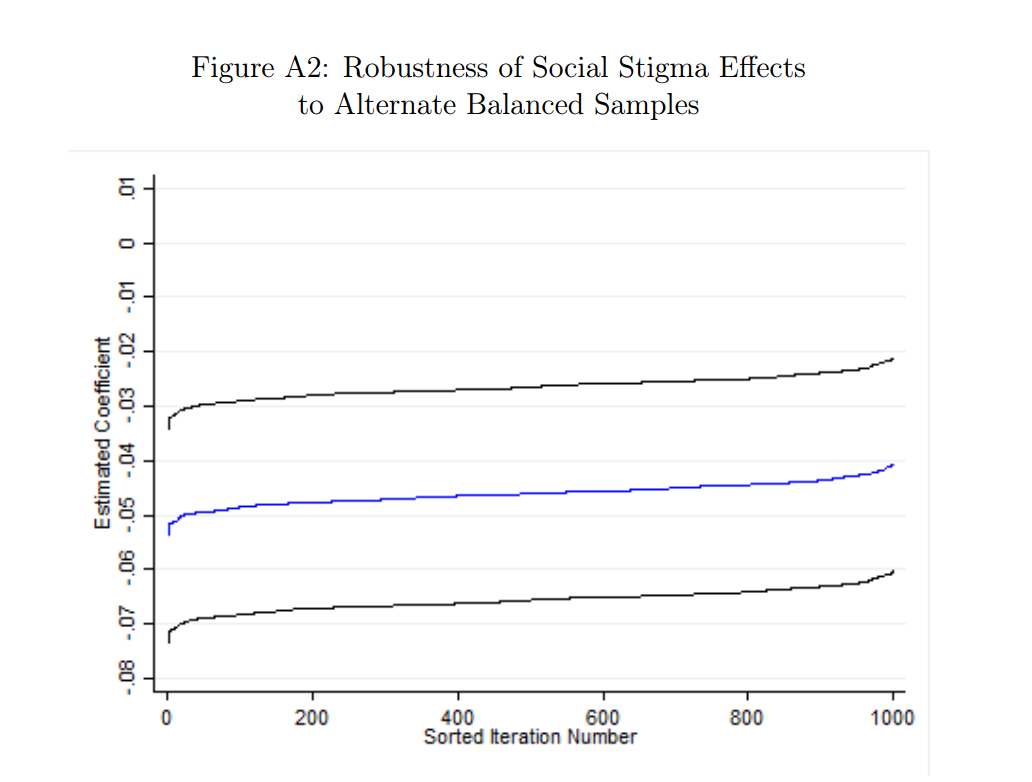
Figure A2: Robustness of Social Stigma Effects to Alternate Balanced Samples
Overall, despite the imbalanced groups, the results of the analysis and robustness checks suggest that stigma is an important consideration for applying to training programs through Facebook, in line with the results from the other two experiments reported above.
Table A5: Balance Table for Facebook Experiment
| (1) Control Group Mean | (2) Professional Stigma | (3) Social Stigma | |
|---|---|---|---|
| Female | 0.53 {0.50} | −0.03*** (0.001) | −0.01*** (0.001) |
| Old | 0.28 {0.02} | 0.03*** (0.001) | 0.01*** (0.001) |
| Obs | 242,789 | 266,050 | 258,929 |
| p-value | 0.00 | 0.00 |
Notes: This table reports how baseline characteristics differ by experimental group. Facebook only provides two covariates, gender, and if the individuals are between 18–24 or between 25–34. We include “Old” as a binary for being in the 25–35 age group. Column 1 reports the mean in the control group with standard deviation in brackets below. Columns 2 and 3 report coefficients from a regression of the covariate on treatment. The bottom row reports the p-value from the joint test of a regression of treatment on the two baseline covariates. Robust standard errors in parentheses. Significance * .10; ** .05; *** .01.
We ran a third randomized experiment about stigma in this context using the Facebook platform. On that platform randomization is not directly controlled by the researchers, and we found significant imbalance in the covariates. Because of this, we report the details of this experiment in the appendix.↩︎
As we discuss in the next section, the term “stigma” is used broadly in the literature and is difficult to define precisely. Here, we use it to refer to disutility from some action that arises from one’s beliefs about how that action will be perceived. Our treatments are designed to alleviate these concerns by changing those beliefs while holding constant their beliefs about the monetary returns to the activities.↩︎
While we did not generate an explicit pre-analysis plan, we designed these projects anticipating that there would be heterogeneity, as did our local partners. This is why we asked about wealth status before randomization despite it being difficult to collect in this context. We also have run two separate experiments with similar designs where we find similar heterogeneity, which protects against the potential of spurious findings. Finally, these machine learning methods allow for data-driven exploration of heterogeneity with corrected inference.↩︎
Eligibility was determined by asking if the respondent is unemployed or underemployed; how old they are; their educational attainment; whether they attended public or private school; and their military status. Randomization occurred at the individual level directly on surveyor tablets after they collected basic information from participants, and hence there was no scope for stratification.↩︎
Christensen and Osman (2021) shows that Uber riders in Cairo are richer on average than the general population.↩︎
We also cross-randomized the price of the program from a small fee of 200 EGP, or about $25, to an incentive payment of about $12.50 (the actual cost to provide the program was around 4500 EGP). We found that application rates decrease with price but do not increase with the incentive. We control for this cross randomization in our analysis.↩︎
We differ from the method outlined in the Chernozhukov et al. (2022) paper in one respect in order to maximize statistical power: we produce groups using the full sample by taking the median ITE across all simulations, whereas they only utilize half of the sample and choose the median coefficients from all simulations.↩︎
If the primary reason for heterogeneity is that there is a “type” of person who doesn’t like long messages, we would expect that the impacts of the “personal” stigma treatment would mimic the impacts of the other two treatments because it is practically the same length. The lack of effects shows it is indeed the content of the treatment that matters.↩︎
This result is not mechanical. The machine learning methods that predict the individual treatment effects (ITEs) utilize split-sample techniques which ensure that the ITEs estimated for each person are “honest”, i.e. estimated using data on other applicants and not their own characteristics.↩︎
An alternative way to consider if there are compositional differences is to check whether application rates differ by particular characteristics, utilizing a regression of sign-ups on treatment and treatment interacted with different baseline characteristics. Results in Panel C are robust to utilizing that alternative specification.↩︎
While inclusion into the sample depended on individuals reporting that they are looking for work, some individuals were already working and engaged in on-the-job search.↩︎
When we include a control for gender in our estimates as a robustness check, it does not substantively change any of our results.↩︎
While our survey experiment provides evidence that we do not affect beliefs about monetary rewards, it was the most straightforward of the treatments we implemented. We cannot rule out that the professional stigma pitch shifted some people’s perceptions of returns, but we think it is less likely given how similar the results are to the social stigma pitch.↩︎
Program participation and program outcomes are by definition linked, so the distinction is not perfect. However, the goal of our main treatments was to alter beliefs about the outcomes, while in the welfare stigma treatment, we only seek to alter beliefs about the “type of person” that the program is meant for.↩︎
The welfare stigma treatment is applied in a separate part of the survey and is thus cross-randomized with the stigma treatments we discussed in Section 3.↩︎
We interpret this as a lack of evidence for any welfare stigma. It is also possible that individuals interpret the program being subsidized as evidence that it is valuable enough that someone paid to subsidize it. This could offset any existing welfare stigma at play.↩︎
One potential area for confusion is that in other machine learning cases the testing set is used to improve the model, but in these methods the cross-validation happens within the training set.↩︎
While conventional tests suggest imbalance Imbens and Wooldridge (2009) suggest utilizing “normalized differences” in situations with large samples like ours. This procedure is similar to a t-test but uses the sample standard deviation instead of the sample standard deviation divided by the number of observations. Unlike the t-statistics, the normalized differences are much below conventional levels of statistical significance, suggesting that the imbalance in covariates is not as severe as it may appear.↩︎